
– Methodical usage of emotions in the project –
Summary
As a project portfolio manager you want to avoid full blown up project audits in all of your projects to identify potential deviations. Therefore you may use a very simple survey to avoid any surprises.
As project director or project portfolio manager, you also have another early warning system at your disposal.
As a project or program manager you want to compare your current endeavor with previous engagements in a very simple way.
There are multiple ways to gather the team morale in project teams. I am using following approach for a few years now with reliable and sound results.
There is a systematic way in doing so by gathering “SmileyPoints” via an online survey tool. Examples for free tools are kwiksurveys.com, the free version of surveymonkey.com or Google Forms.
Questions to gather in the survey
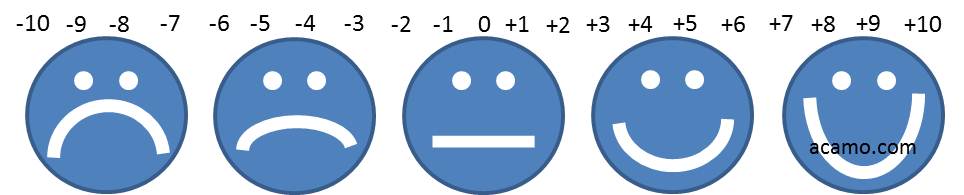
- “How happy are you being on the program/project?” Then the below picture should be attached to this question.
- “What can Program / Project Management do to improve?”
- “What can you do yourself do to improve?”
- “Rumor Box: If there are rumors around and you have any questions related to these please let us know here to clarify.”
In larger programs you may add a question to identify the participant’s team assignment to be able to give indication on the discrepancies between the different teams within the program.
The survey should be run every second week in case of a longer lasting projects or programs. It can be a good trend indication during the project life cycle. The minimum participation of project members should exceed at least 10% of all project team members. Less will not be representative. For smaller teams a higher minimum participation ratio must be achieved.
Result interpretations
The average and the standard deviation of all results of responses to question number one gives you a clear indication on the team morale within the program or project team.
The higher the standard deviation of all values to question one the more obvious are
– a lack of communication within the team
(especially from top to down and bottom to up)
– roles and responsibilities not well defined or not transparent to the team and
– the scope not well defined or not transparent – at least to the extended team
The lower the average value of the results to question one is the less attractive is the project for the team members. Therefore the enthusiasm being part of the project is lower too. In very critical project situations (e. g. work life balance not achievable due to work load) the average tends to be low.
Now the question comes up of there is a *correlation between standard deviation and average”? Not really in all instances. The standard deviation should be low in a well-organized program. In the same over-worked organization if such things as structures, roles and responsibilities, communication channels, scope are well defined and transparent to the team the standard deviation should be still low.
The next questions is what is low and what is high”? A good one! Experience shows that values between +2 and +4 as an *averageare very common for projects in good shape. Of course there is a tendency for new joiners in a project to rate their personal happiness in areas of +6 to +10. These artifacts need a critical mass of responses to balance out.
This does not support the hypothesis that a new project with new team does automatically mean a good SmileyPoint average value. The team as a whole is well observing all team quality criteria before providing their SmileyPoints and in average the rating will be again to the “real” value.
On the other end of the SmileyPoint scale low average values as -6 to -2 indicate projects which are in a turnaround mode or at least in a need to turnaround. Immediate actions need to take place.
For standard deviation following pattern can be identified. Values of 6 show massive deficit of structures implemented, missing role definitions or at least transparency on it. Criteria e) to i) from below listing do impact the standard deviation up to my experience. Programs in a good shape show a standard deviation of less than 3.
Of course a survey like this will not replace individual talks and interviews but it gives you a very precise supporting evidence of your findings in conversation or at least an initial feeling in case you did not have any contact to the program at all.
In a next posting I will list a couple of elements and ideas on what to implement to improve the SmileyPoints in your team.
Your comments and participation to improve SmileyPoints
Use SmileyPoints actively in your projects!
Your comments and active participation are welcome. Both can be entered in the following survey and you will be informed about new findings on request.
This values shall be gathered
– average and
– standard deviations
– number of participants out of total number of team members
from some of your projects and programs. Especially helpful would be if you can add a typical auditors or your personal rating on the same scale from below on following topic clusters:
a. team morale within the extended team
b. program financials in good shape and transparent to the project management
c. infrastructure well established (e. g. printers, office space)
d. right skills on board
e. architecture and solution well defined
f. methodologies applied properly
(e. g. project planning, issue and risk management)
g. roles and responsibilities and structure well defined
h. scope and acceptance and completion criteria well defined and transparent
i. governance well defined and in place
Please use this form to submit your feedback to improve SmileyPoints.
This article was originally published on 23.07.2011 on GooglePlus.