If you are leaving a program, you should consider a few things when preparing and handing over the program. Here, a 6-phase approach has proven to be the best for me, which I use again and again.
1. Preparation (as early as possible!)
Align with stakeholders
Outline Knowledge-Transfer-Plan
Agree budget for knowledge transfer period
Search for successor and receive okay on specific person from stakeholders
Confirm final start date of successor (adapt timeline of knowledge transfer plan)
2. On-boarding (-3 weeks)
Successor starts on project as additional source
Project assignment to be defined
Onboard successor following all regular administration activities as access rights, calendar invites, handover process documentation etc.
Introduce successor in newsletter
Shadowing (-2 weeks)
3. Shadowing (-2 weeks)
Successor is your current stand in if anyhow possible
Successor attends all of your meetings too
Successor is watching all of your core activities
Successor updates and amends joint knowledge transfer plan and ticks off activities
4. Re-Shadowing (-1 week)
Show less presence, only attend team
meetings but no customer meetings
Be there for any help for your
successor
Be prepared to take over some
operational activities
Send all still incoming requests /
questions to your successor
5. Backup (starts with day of handover)
Show less presence, only attend team
meetings but no customer meetings
Be there for any help for your
successor
Be prepared to take over some
operational activities
Send all still incoming requests /
questions to your successor
6. Phase Out (+1 week)
Process all off-boarding activities
for yourself
Release Project Assignment
Be there to help your successor
Do not take any operation tasks
anymore
Give a farewell party and say good
bye in the newsletter.
Send all still incoming requests /
questions to your successor
Leave! (+2 weeks)
Success factors for a proper handover
Involve customer and all stakeholder
in an early stage.
Do not arrange processes program /
stream person centric but process / accountable centric.
Do
not be single point of contact for multiple processes yourself,
Instead
make each of your team member accountable for one or more processes from the
beginning of the engagement (Management by Objective).
Plan and prepare your leave as an
own project itself.
Prepare a knowledge transfer plan
which must be agreed by all stakeholders.
Break
down knowledge transfer in granular activities (1-3 hours).
Ask
your successor to maintain this plan and tick each closed activity off.
Handle
this plan and update it like any other project plan.
Communicate your leave to whole team
latest at beginning of knowledge transfer period.
Foresee a backup period after
successful knowledge transfer of up to two weeks.
Define a clear handover date in
knowledge transfer plan.
Summary: Using a project planning and control software only as a visual representation of the planning status is a waste of time. A few tips have to be followed and MS Project and Co are also very useful for project monitoring and control.
I often hear from prospective project managers, but also from experienced project managers, that a project management tool such as MS Project is not practicable. It is too complicated and the actual control is not really possible.
If you consider the following tips nothing will go wrong anymore:
Set in the options that MS Project or the tool of your choice will base the planning on “fixed work”.
The availability (hourly capacity and holidays) of resources/qualifications must be entered in the project calendar.
Do not set a manual date (fixed date), except project start or finish date.
For each task / work package, a predecessor (at least the project start milestone) and successor (at least the project end milestone) must be entered.
Do not enter a duration, only the effort for the task / work package.
Only one resource/qualification should be entered for each activity.
Always display the critical path in the schedule (Gantt). This must be displayed throughout the entire project duration without interruption. Otherwise there is an error, e.g. manual date set.
Only plan detailed for a maximum of 2-3 months in advance (resources and effort).
And the last obstacle is again and again that your company does not invest an MS Project license for you. Then get ProjectLibre as Opensource or another freeware.
2min.Effective meetings are always a challenge. There are many guidelines and checklist available for meetings. But up to now I have not found a good template for an effective meeting agenda.
In my daily usage I identified the need for two different agenda formats depending on the length of the meeting or better the number of agenda topics.
Having a telco I always use following simple format (in case not many topics need to be covered) since years:
INITIAL SITUATION/AUSGANGSSITUATION
Project status needs to be reported to steerco until Friday 12:00 CET
Please update your work packages until Thursday 10:00 CET Server Link (ALL)
Please update action items status / resolution Server Link (ALL)
Update reporting template (ML)
AGENDA
Review interface issues between work packages (MW)
Align on action items across work packages (MW)
Align on Team Discussions items on project server (ML)
Issues and risks to be aligned on (ML)
RESULTS EXPECTED OF THE MEETING/ ERWARTETE ERGEBNISSE DES MEETINGS
Aligned view on the project status
NEXT STEPS AFTER THE MEETING/ NÄCHSTE SCHRITTE IM NACHGANG ZUM MEETING
Report to be consolidated (ML)
Report to be reviewed and send to steerco (MW)
For face2face workshops or long lasting telcos I prefer using following format also for many years:
Berlin, Hauptstr. 14-16, 1.OG, Room E1.15a, Monday 05. Feb 2018 – CMO FMO Big Picture Goal: Common understanding of CMO and FMO Big Pictures and related activities Approach: Time Boxing Preparation: Presentation: Link on Server Materials: 2 beamers, moderation suitcase
Time (CET)
Topic
Host
Input and preparation needed / Owner
Result expected / Owner
Attendees
09:30 – 10:00
Introduction and target of meeting
MW
Introduction – no preparation needed
All
All
10:00 – 10:30
CMO Picture Overall
LI
Slide deck / LI
Common understanding of the CMO
All
10:30 – 10:45
Break
All
10:45 – 12:45
CMO / FMO INM
LI
Understanding CMO slide deck on specific process / LI
Black Board FMO Picture / CS
LI, CS, MA, UA and UA
12:45 – 13:30
Lunch break in restaurant
All
13:30 – 14:15
CMO / FMO PRM
LI
Understanding CMO slide deck on specific process / LI
Black Board FMO Picture / CS
LI, CS, MA, UA and AB
14:15 – 15:00
CMO / FMO CHM
LI
Understanding CMO slide deck on specific process / LI
Black Board FMO Picture / CS
LI, CS, MA, UA and SE
15:00 – 15:30
CMO / FMO CFM
LI
Understanding CMO slide deck on specific process / LI
Black Board FMO Picture / CS
LI, CS, MA, UA and ME
15:30 – 15:45
Coffee Break
All
15:45 – 16:15
CMO / FMO CPM
LI
Understanding CMO slide deck on specific process / LI
Black Board FMO Picture / CS
KE, CS, MA, UA and KL
16:15 – 17:00
Wrap up and next steps
MW
Action item log updated. / MW
Work package descriptions amended. / work package owners
As a project portfolio manager you want to avoid full blown up project audits in all of your projects to identify potential deviations. Therefore you may use a very simple survey to avoid any surprises.
As a project or program manager you want to compare your current endeavor with previous engagements in a very simple way.
There are multiple ways to gather the team morale in project teams. I am using following approach for a few years now with reliable and sound results.
There is a systematic way in doing so by gathering “SmileyPoints” via an online survey tool. Examples for free tools are kwiksurveys.com, the free version of surveymonkey.com or Google Forms.
Questions to gather in the survey
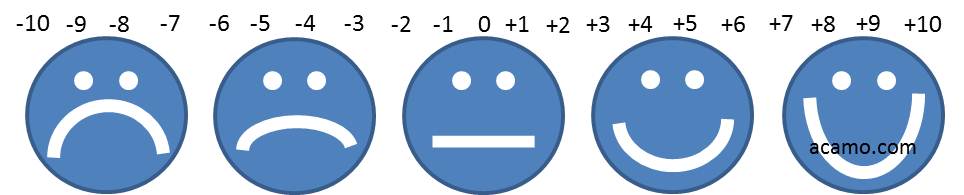
“How happy are you being on the program/project?” Then the below picture should be attached to this question.
“What can Program / Project Management do to improve?”
“What can you do yourself do to improve?”
“Rumor Box: If there are rumors around and you have any questions related to these please let us know here to clarify.”
In larger programs you may add a question to identify the participant’s team assignment to be able to give indication on the discrepancies between the different teams within the program.
The survey should be run every second week in case of a longer lasting projects or programs. It can be a good trend indication during the project life cycle. The minimum participation of project members should exceed at least 10% of all project team members. Less will not be representative. For smaller teams a higher minimum participation ratio must be achieved.
Result interpretations
The average and the standard deviation of all results of responses to question number one gives you a clear indication on the team morale within the program or project team.
The higher the standard deviation of all values to question one the more obvious are – a lack of communication within the team (especially from top to down and bottom to up) – roles and responsibilities not well defined or not transparent to the team and – the scope not well defined or not transparent – at least to the extended team
The lower the average value of the results to question one is the less attractive is the project for the team members. Therefore the enthusiasm being part of the project is lower too. In very critical project situations (e. g. work life balance not achievable due to work load) the average tends to be low.
Now the question comes up of there is a *correlation between standard deviation and average”? Not really in all instances. The standard deviation should be low in a well-organized program. In the same over-worked organization if such things as structures, roles and responsibilities, communication channels, scope are well defined and transparent to the team the standard deviation should be still low.
The next questions is what is low and what is high”? A good one! Experience shows that values between +2 and +4 as an *averageare very common for projects in good shape. Of course there is a tendency for new joiners in a project to rate their personal happiness in areas of +6 to +10. These artifacts need a critical mass of responses to balance out.
This does not support the hypothesis that a new project with new team does automatically mean a good SmileyPoint average value. The team as a whole is well observing all team quality criteria before providing their SmileyPoints and in average the rating will be again to the “real” value.
On the other end of the SmileyPoint scale low average values as -6 to -2 indicate projects which are in a turnaround mode or at least in a need to turnaround. Immediate actions need to take place.
For standard deviation following pattern can be identified. Values of 6 show massive deficit of structures implemented, missing role definitions or at least transparency on it. Criteria e) to i) from below listing do impact the standard deviation up to my experience. Programs in a good shape show a standard deviation of less than 3.
Of course a survey like this will not replace individual talks and interviews but it gives you a very precise supporting evidence of your findings in conversation or at least an initial feeling in case you did not have any contact to the program at all.
In a next posting I will list a couple of elements and ideas on what to implement to improve the SmileyPoints in your team.
Your comments and participation to improve SmileyPoints
Use SmileyPoints actively in your projects!
Your comments and active participation are welcome. Both can be entered in the following survey and you will be informed about new findings on request.
This values shall be gathered – average and – standard deviations – number of participants out of total number of team members
from some of your projects and programs. Especially helpful would be if you can add a typical auditors or your personal rating on the same scale from below on following topic clusters: a. team morale within the extended team b. program financials in good shape and transparent to the project management c. infrastructure well established (e. g. printers, office space) d. right skills on board e. architecture and solution well defined f. methodologies applied properly (e. g. project planning, issue and risk management) g. roles and responsibilities and structure well defined h. scope and acceptance and completion criteria well defined and transparent i. governance well defined and in place